The main challenge with measuring the market’s supply/demand strength, is that demand data is notoriously lagged. Hence, in terms of the market strength, the best real-time gauge is the capacity side, where blank sailings are a key element, Sea-Intelligence reports.
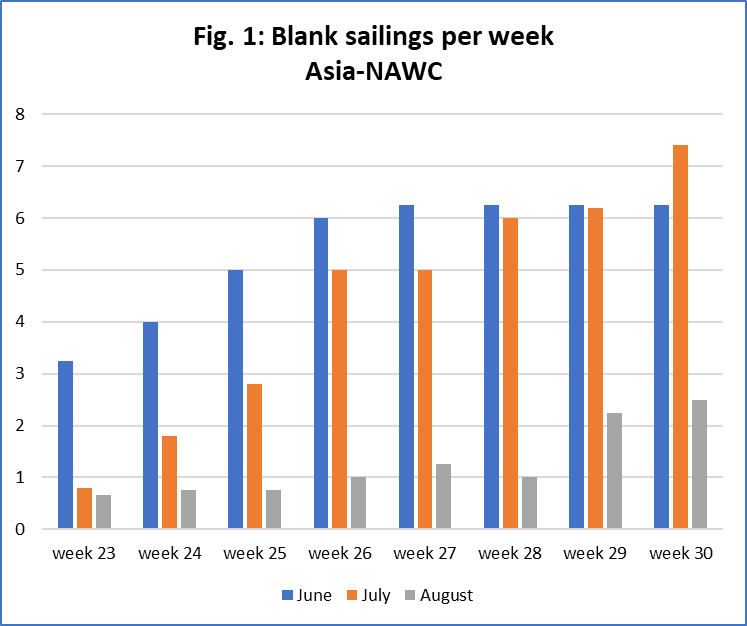
Figure 1 shows the ramp up in Asia-North America West Coast (NAWC) blank sailings for June-August. Just to clarify, the figure shows the blank sailings for the months of June-August as they were in each individual week from week 23-30.

The average number of weekly blank sailings in June was ramped up in the period of week 23- 26, indicating late announcements of some blanks. The orange bars in Figure 1 show the development for July, where it can be seen there is a steep increase from week 25 to week 26, which is at the very end of June. Finally it can also be seen that there has been an increase in blank sailings for August in the last two weeks of July. This level of blank sailings is substantially higher in Asia-NAWC than in the three other trades.
Digging deeper, we find a clear correlation between the sharp uptick in blank sailings activity on the Transpacific at the end of June, and the subsequent improvement in spot rates. There was also an uptick in blanking activity on Asia-North Europe at the end of June, although it has not resulted in spot rate increase, implying that the “tool” of blanking sailings in itself has been insufficient to stem the seeping rates. For Asia-MED the carriers have been quite unwilling to blank sailings. One explanatory variable here might be the very large rate premium on the Asia-MED versus the Asia-North Europe trade.


