The Bunker Outlook was contributed by Marine Bunker Exchange (MABUX)
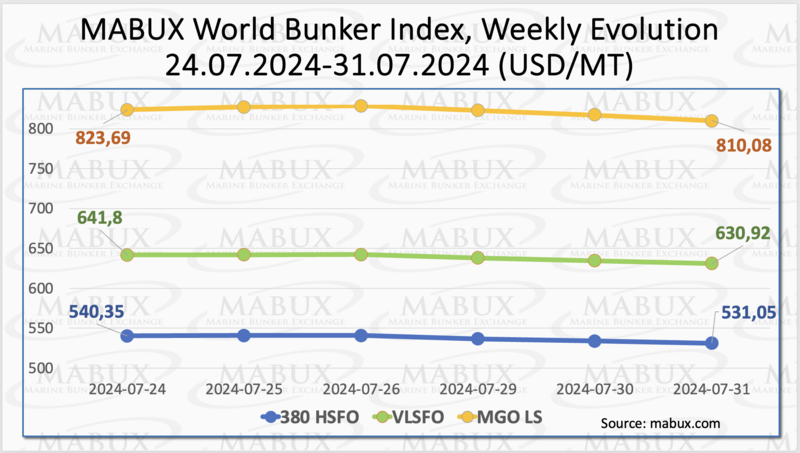
Over the 31st week, the the MABUX global bunker indices continued their downward trajectory. The 380 HSFO index fell by another 9.30 USD: from 540.35 USD/MT last week to 531.05 USD/MT, gradually nearing the 500 USD mark. The VLSFO index declined by 10.88 USD (630.92 USD/MT versus 641.80 USD/MT last week). The MGO index dropped by 13.61 USD (from 823.69 USD/MT last week to 810.08 USD/MT), approaching the 800 USD mark. At the time of writing, the global bunker indices showed signs of a moderate upward reversal.
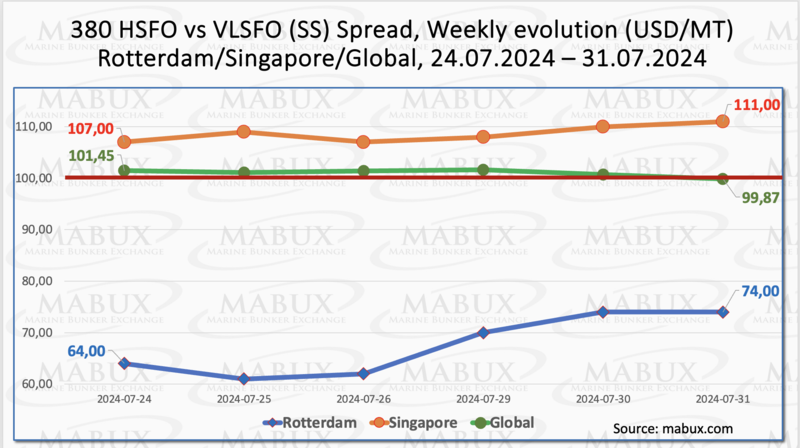
The MABUX Global Scrubber Spread (SS) - the price difference between 380 HSFO and VLSFO - experienced a moderate decrease: minus $1.58 ($99.87 versus $101.45 last week), once again breaching the $100.00 mark (SS Breakeven). The weekly average also saw a slight decrease of $0.38. In Rotterdam, the SS Spread widened by $10.00 to $74.00 versus $64.00 last week, with the weekly average increasing by $0.33. In Singapore, the 380 HSFO/VLSFO spread rose by $4: from $107.00 last week to $111.00, remaining above the $100.00 mark. The weekly average in the port widened by $4.50. Currently, there is still no clear trend in the dynamics of the Global SS Spread and SS indices in ports. We do not anticipate significant changes in the SS Spread trends next week. More detailed information is available in the "Differentials" section of www.mabux.com.
The latest development in LNG supply and European prices shows the vulnerability of Europe’s benchmark prices to supply outages. Meantime, as of July 15, Europe’s natural gas storage sites are already 82.5% full. At current supply and demand dynamics, the EU will easily manage to fill its storage sites well ahead of the winter heating season. Over the week 31, the European gas benchmark TTF rose slightly: plus 2,739 EUR/MWh (34,361 EUR/MWh vs. 31,622 EUR/MWh last week).
The price of LNG as a bunker fuel in the port of Sines (Portugal) increased by another USD 13 over the week compared to the previous week, reaching USD 754/MT on July 29. At the same time, the price difference between LNG and conventional fuel on July 29 decreased to USD 46 in favor of LNG, compared to USD 75 the previous week. MGO LS was quoted at USD 800/MT on that day in the port of Sines. More detailed information is available in the LNG Bunkering section on www.mabux.com.
In Week 31, the MDI index (the correlation ratio of market bunker prices (MABUX MBP Index) vs. MABUX digital bunker benchmark (MABUX DBP Index)) registered the following bunker price trends in the world's four largest hubs: Rotterdam, Singapore, Fujairah and Houston:
• 380 HSFO segment: All four ports remained in the undercharge zone, with weekly averages down 4 bps in Rotterdam, 6 bps in Singapore and 10 bps in Houston, but up 7 bps in Fujairah.
• VLSFO segment: All four ports remained undervalued, with weekly averages declining further by 6 bps in Rotterdam, 13 bps in Singapore, 7 bps in Fujairah, and 3 bps in Houston. The MDI indices in both Singapore and Fujairah approached the 100% correlation mark between the market price and the MABUX digital benchmark.
• MGO LS segment: The MDI index in Houston showed the 100% correlation between the market price and the MABUX digital benchmark, decreasing by 5 bps. The other three ports were undervalued. The underpricing weekly averages decreased by 2 points in Singapore and Fujairah. The MDI index in Rotterdam remained unchanged. Meantime, the indices in Rotterdam and Singapore stayed close to the $100 mark.
Over the week, the balance of overvalued/undervalued ports swung again towards undervaluation. We expect the underpricing trend for all types of bunker fuel to continue next week.
For more details on the correlation between market prices and the MABUX digital benchmark, visit the “Digital Bunker Prices” section on www.mabux.com.
Clarksons Research has released its latest Green Technology Tracker, revealing continued investment in alternative fuels during the first half of 2024. These investments represented about one-third of all newbuild orders and 41% of the total tonnage ordered. Orders were placed for vessels capable of using LNG (109 orders, with 51 excluding LNG carriers), methanol (49 orders), ammonia (15 orders), LPG (42 orders), and hydrogen (4 orders). Excluding LNG carriers, the proportion of LNG fuel-capable tonnage increased relative to methanol-capable tonnage compared to 2023 levels. However, the share of alternative fuel orders declined from the 2022 peak of 54% of tonnage ordered, due to a shift in the types of ships being ordered, particularly a decrease in containership orders in the first half of 2024. The current orderbook shows that approximately 50% of the tonnage is alternative fuel capable. Clarksons Research projects that by the end of the decade, over 20% of fleet capacity will be alternative fuel capable, up from 7% in 2024 and just 2% in 2017. Despite these advancements, investments in port infrastructure and the availability of 'green' fuels are lagging behind demand. Currently, 273 ports have LNG bunkering facilities, and 251 ports have shore power connections either available or planned. In stark contrast, only 29 ports have methanol bunkering available or planned.
We expect that next week global bunker indices have the potential to resume their upward trend.
By Sergey Ivanov, Director, MABUX
All news


