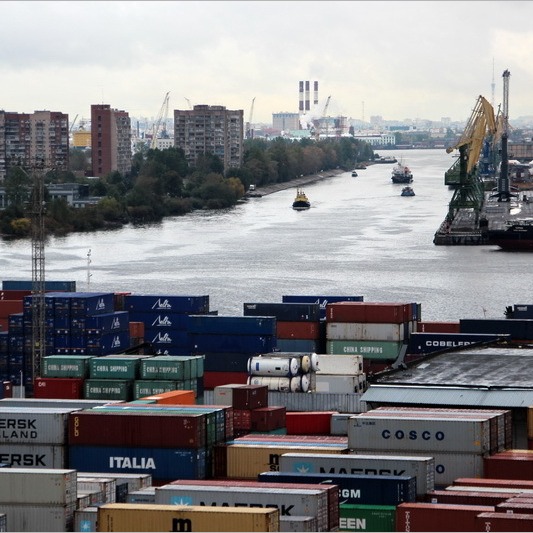
Liquid bulk cargo transshipment rose with handling of dry bulk cargo having shown a decrease
 In January-December 2020, the Port of St. Petersburg handled 59.88 million tonnes of cargo (flat, year-on-year). According to the port authority, transshipment of liquid bulk cargo grew by 16% to 11.42 million tonnes, dry bulk cargo – fell by 6% to 8.2 million tonnes, handling of general cargo – up 1% to 11.99 million tonnes, transshipment of Ro-Ro cargo – down 4% to 1,152,600 tonnes, dry loose cargo – down 22% to 261,100 tonnes including 251,700 tonnes of timber (-39%).
The port’s container throughput fell by 5% to 2,099,649 TEU.
In 2019, the port handled 59.87 mln t of cargo, its container throughput was 2.22 mln TEUs.
|
Port |
Type of cargo |
Throughput thou t, 2018 |
Throughput thou t, 2019 |
Throughput thou t, 2020 |
2020 vs 2019 |
|
Port of Saint-Petersburg |
TOTAL: |
59,325.4 |
59,879.5 |
59,884.4 |
100% |
|
|
DRY BULK CARGO including: |
8,448.3 |
8,751.2 |
8,205.7 |
94% |
|
|
Ore |
818.1 |
730.2 |
870.1 |
119% |
|
|
Coal, coke |
324.9 |
180.3 |
54.8 |
30% |
|
|
Mineral fertilizers |
7,302.9 |
7,773.8 |
7,144.3 |
92% |
|
|
Other |
2.4 |
66.9 |
136.5 |
2-fold growth |
|
|
DRY LOOSE CARGO including: |
328.9 |
334.1 |
261.1 |
78% |
|
|
Grain |
273.2 |
269.3 |
159.0 |
59% |
|
|
Other |
55.7 |
64.8 |
102.0 |
158% |
|
|
TIMBER |
344.1 |
411.0 |
251.7 |
61% |
|
|
GENERAL CARGO including: |
13,720.7 |
11,890.2 |
11,992.7 |
101% |
|
|
Ferrous metal |
6,278.7 |
4,943.6 |
5,230.4 |
106% |
|
|
Non-ferrous metal |
1,343.9 |
1,299.2 |
914.2 |
70% |
|
|
Metal scrap |
1,901.1 |
1,483.7 |
1,853.0 |
125% |
|
|
Packaged |
1,368.9 |
1,559.8 |
1,651.5 |
106% |
|
|
Reefer |
1,341.8 |
1,317.4 |
1,122.8 |
85% |
|
|
including fish |
399.5 |
423.3 |
323.7 |
76% |
|
|
Other |
1,486.3 |
1,286.5 |
1,220.8 |
95% |
|
|
CONTAINERS |
25,942.5 |
27,419.7 |
26,591.2 |
97% |
|
|
Total teus |
2,130,721 |
2,221,724 |
2,099,649 |
95% |
|
|
including refrigerated containers: |
270,400 |
255,285 |
260,797 |
102% |
|
|
CARGO CARRIED by FERRIES |
1.6 |
44.5 |
1.2 |
3% |
|
|
RO-RO |
1,414.7 |
1,205.9 |
1,152.6 |
96% |
|
|
LIQUID BULK CARGO including: |
9,124.7 |
9,823.0 |
11,428.2 |
116% |
|
|
Oil products |
9,124.7 |
9,823.0 |
11,428.2 |
116% |


