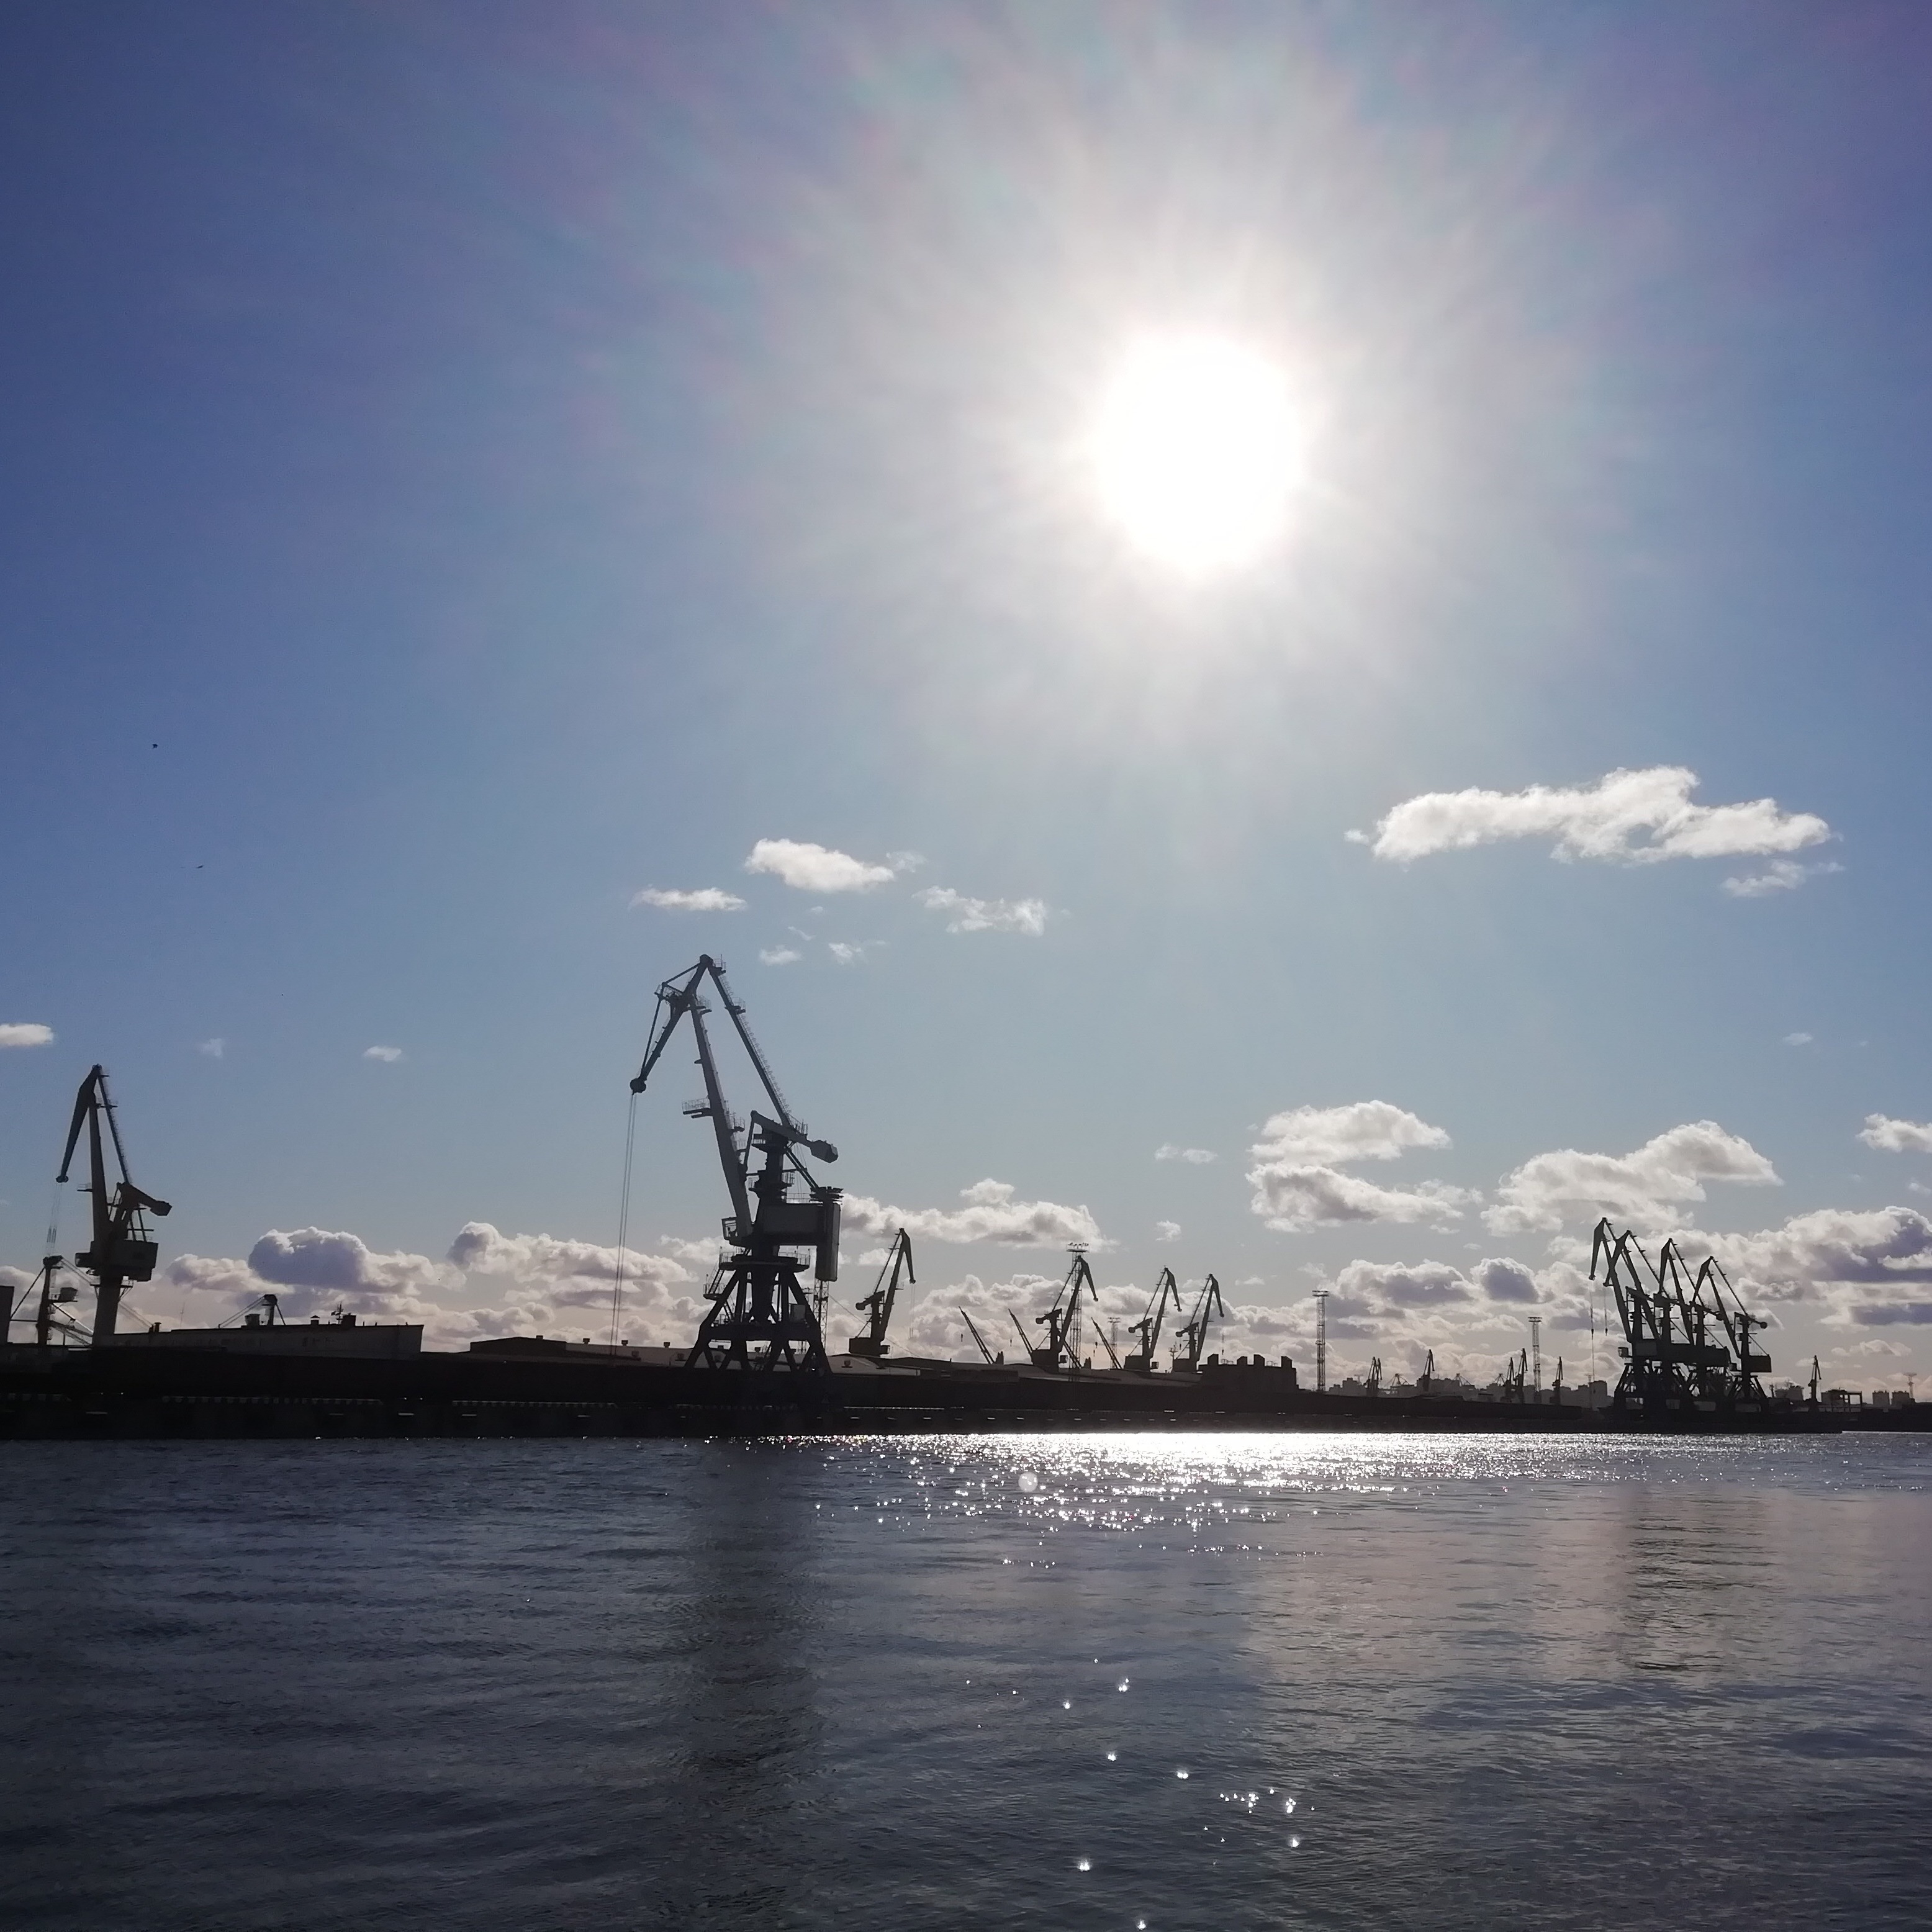
Dry loose and liquid bulk cargo handling continues going down while haling of dry bulk cargo is rising

In January-March 2021, the Port of St. Petersburg handled 14.44 million tonnes of cargo (-2%, year-on-year). According to the port authority, handling of liquid bulk cargo fell by 3% to 2.59 million tonnes, handling of dry bulk cargo rose by 28% to 1.91 million tonnes.
In the reported period, handling of general cargo fell by 2% to 3.06 million tonnes, Ro-Ro cargo – up 31% to 338,300 tonnes, dry loose cargo – down 57% to 46,700 tonnes, timber - up 10% to 59,300 tonnes. Handling of cargoes carried by ferries surged by 99% to 600 tonnes.
The port’s container throughput fell by 11% to 2.09 million TEUs.
In 2020, the port handled 59.88 mln t of cargo, its container throughput was 2.09 mln TEUs.
|
Port |
Type of cargo |
Throughput thou t, 2019 |
Throughput thou t, 2020 |
Throughput thou t, 2021 |
2021 vs 2020 |
|
Saint-Petersburg |
TOTAL: |
14,263.0 |
14,759.6 |
14,442.8 |
98% |
|
|
DRY BULK CARGO including: |
1,993.3 |
1,499.4 |
1,915.5 |
128% |
|
|
Ore |
157.3 |
207.4 |
146.0 |
70% |
|
|
Coal, coke |
51.5 |
18.0 |
10.0 |
56% |
|
|
Mineral fertilizers |
1,782.4 |
1,239.6 |
1,731.4 |
140% |
|
|
Other |
2.0 |
34.4 |
28.1 |
82% |
|
|
DRY LOOSE CARGO including: |
109.4 |
107.7 |
46.7 |
43% |
|
|
Grain |
96.2 |
70.5 |
18.6 |
26% |
|
|
Other |
13.2 |
37.2 |
28.1 |
76% |
|
|
TIMBER |
86.9 |
53.9 |
59.3 |
110% |
|
|
GENERAL CARGO including: |
3,054.5 |
3,123.1 |
3,062.2 |
98% |
|
|
Ferrous metal |
1,343.5 |
1,511.4 |
1,650.8 |
109% |
|
|
Non-ferrous metal |
338.6 |
270.2 |
222.4 |
82% |
|
|
Metal scrap |
314.2 |
449.0 |
338.5 |
75% |
|
|
Packaged |
374.0 |
381.0 |
290.5 |
76% |
|
|
Reefer |
304.8 |
248.2 |
237.1 |
96% |
|
|
including fish |
75.9 |
46.8 |
66.0 |
141% |
|
|
Other |
379.4 |
263.4 |
323.0 |
123% |
|
|
CONTAINERS |
6,659.8 |
7,048.4 |
6,427.1 |
91% |
|
|
Total teus |
564,596 |
561,950 |
499,640 |
89% |
|
|
including refrigerated containers: |
79,028 |
75,688 |
69,381 |
92% |
|
|
CARGO CARRIED by FERRIES |
2.9 |
0.3 |
0.6 |
199% |
|
|
RO-RO |
298.3 |
259.0 |
338.3 |
131% |
|
|
LIQUID BULK CARGO including: |
2,058.0 |
2,667.8 |
2,593.2 |
97% |
|
|
Oil products |
2,058.0 |
2,667.8 |
2,593.2 |
97% |


