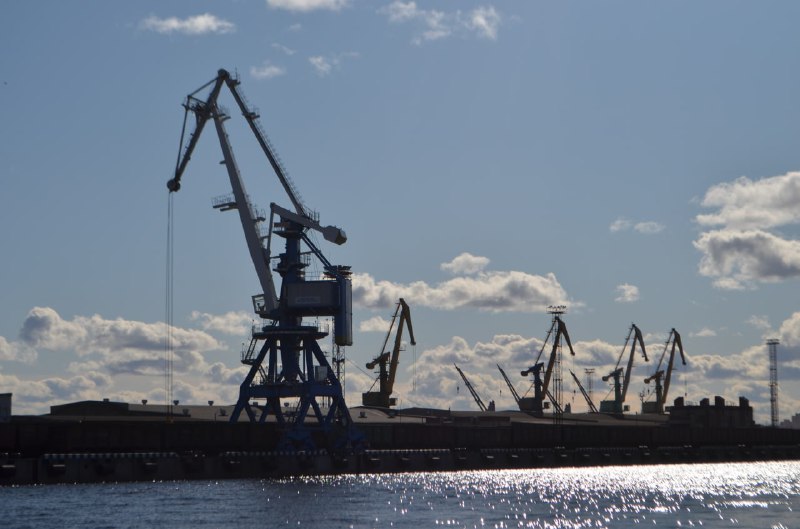
In January-December 2021, the Port of St. Petersburg handled 62.03 million tonnes of cargo (+4%, year-on-year). According to the port authority, handling of liquid bulk cargo climbed by 1% to 11.48 million tonnes, handling of dry bulk cargo rose by 9% to 8.97 million tonnes.
In the reported period, handling of general cargo rose by 13% to 13.49 million tonnes, Ro-Ro cargo – by 25% to 1.44 million tonnes, dry loose cargo – up 4% to 270,400 tonnes including 291,100 tonnes of timber (+16%). Handling of cargoes carried by ferries surged 2.7 times to 3,300 tonnes.
The port’s container throughput fell by 3% to 2,042,358 TEUs.
In 2020, the port handled 59.88 mln t of cargo, its container throughput was 2.09 mln TEUs.
|
Port |
Type of cargo |
Throughput thou t, 2019 |
Throughput thou t, 2020 |
Throughput thou t, 2021 |
2021 vs 2020 |
|
Port of Saint-Petersburg |
DRY BULK CARGO including: |
59,879.5 |
59,884.4 |
62,031.1 |
104% |
|
Ore |
8,751.2 |
8,205.7 |
8,971.3 |
109% |
|
|
Coal, coke |
730.2 |
870.1 |
965.5 |
111% |
|
|
DRY BULK CARGO including: |
180.3 |
54.8 |
40.0 |
73% |
|
|
Mineral fertilizers |
7,773.8 |
7,144.3 |
7,814.4 |
109% |
|
|
Other |
66.9 |
136.5 |
151.4 |
111% |
|
|
DRY LOOSE CARGO including: |
334.1 |
261.1 |
270.4 |
104% |
|
|
Grain |
269.3 |
159.0 |
117.0 |
74% |
|
|
Other |
64.8 |
102.0 |
153.4 |
150% |
|
|
TIMBER |
411.0 |
251.7 |
291.1 |
116% |
|
|
GENERAL CARGO including: |
11,890.2 |
11,992.7 |
13,494.0 |
113% |
|
|
Ferrous metal |
4,943.6 |
5,230.4 |
6,885.7 |
132% |
|
|
Non-ferrous metal |
1,299.2 |
914.2 |
963.5 |
105% |
|
|
Metal scrap |
1,483.7 |
1,853.0 |
1,586.7 |
86% |
|
|
Packaged |
1,559.8 |
1,651.5 |
1,509.1 |
91% |
|
|
Reefer |
1,317.4 |
1,122.8 |
1,104.5 |
98% |
|
|
including fish |
423.3 |
323.7 |
328.8 |
102% |
|
|
Other |
1,286.5 |
1,220.8 |
1,444.4 |
118% |
|
|
CONTAINERS |
27,419.7 |
26,591.2 |
26,071.5 |
98% |
|
|
Total teus |
2,221,724 |
2,099,649 |
2,042,358 |
97% |
|
|
including refrigerated containers: |
255,285 |
260,797 |
267,602 |
103% |
|
|
CARGO CARRIED by FERRIES |
44.5 |
1.2 |
3.3 |
Up 2.7 times |
|
|
RO-RO |
1,205.9 |
1,152.6 |
1,442.2 |
125% |
|
|
LIQUID BULK CARGO including: |
9,823.0 |
11,428.2 |
11,487.3 |
101% |
|
|
Oil products |
9,823.0 |
11,428.2 |
11,487.3 |
101% |


