

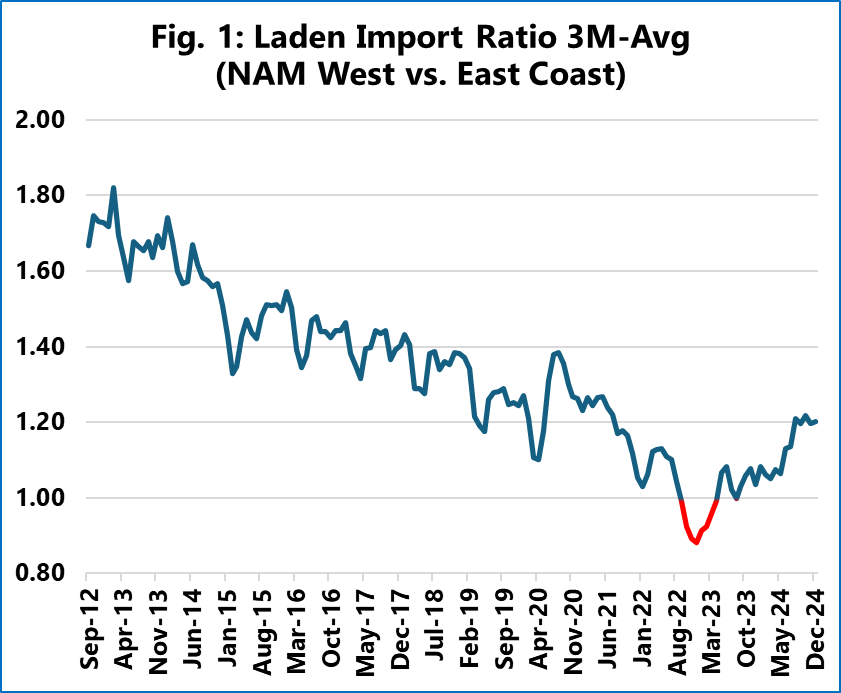
Figure 1 shows the ratio of laden imports between the East and West Coast North America ports. A figure higher than 1 represents more volumes being handled by the West Coast ports, whereas a value lower than 1 means more volumes being handled by the East Coast ports, Sea Intelligence reports.
Up until the end of 2022, the trend was a downwards one, moving in favour of the East Coast ports. At its lowest point, the ratio dropped to 0.88 in December 2022. This was followed by a return to parity by mid-2023, but it was well within the normal volatility seen over the course of the decade. In the months that followed, there was no further drop, with the ratio hovering between 1.0-1.1 in favour of the West Coast ports.
What is different this time, is that after the prolonged level of stability, there has been no further continuation of the downwards trend, and instead, in the second half of 2024, the ratio increased sharply, peaking at 1.22 in October 2024, and staying at 1.20 in both November and December.
The timing of the increase in West Coast port volumes – and de facto the ratio of total volumes between the two coasts – indicates that this is potentially the result of front-loading of peak season cargo to the West Coast ports, in anticipation of a US East Coast port strike. Under normal circumstances, one would expect front-loading of cargo to US East Coast ports instead. However, with the challenge of an increasingly congested Panama Canal, and the increased transit times for services going via the Cape of Good Hope, it is possible that shippers instead opted to take the much faster Eastbound Asia-US West Coast route, but leaving enough buffer to move the cargo from the West Coast to the East Coast.